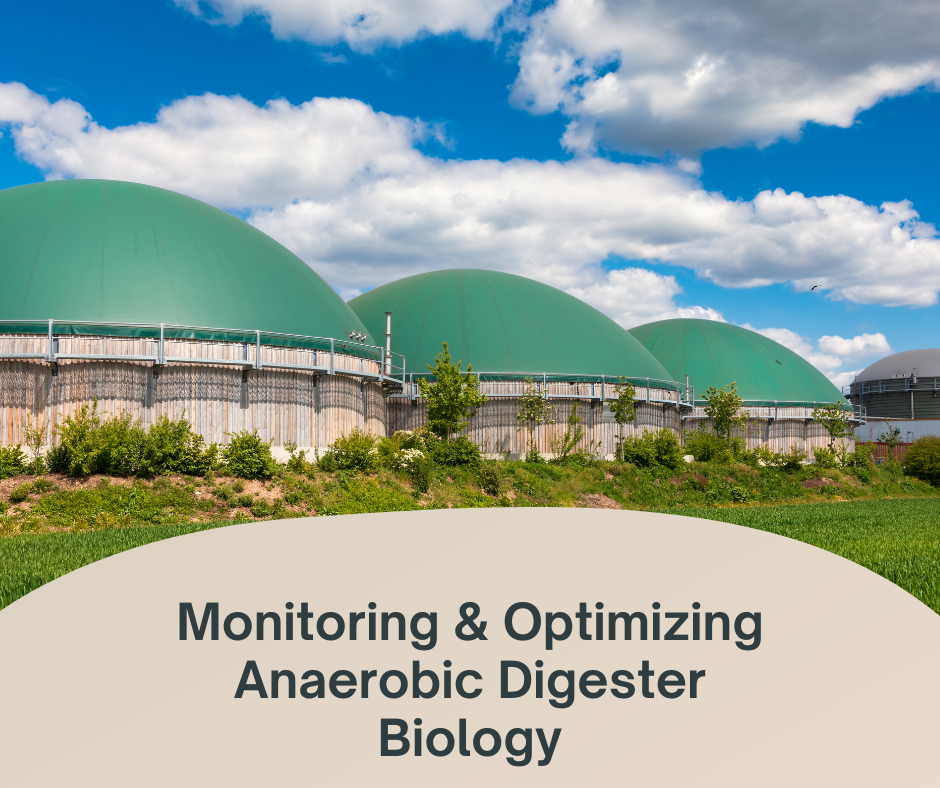
Anaerobic digesters are marvels of sustainable technology, transforming organic waste—like manure, food scraps, and sewage—into renewable energy in the form of biogas while reducing greenhouse gas emissions. At their core, these systems rely on a complex community of microorganisms, primarily bacteria and archaea, that break down complex organics in an oxygen-free environment. But like any biological process, anaerobic digestion can be finicky. Poor performance leads to low methane yields, excessive CO2, incomplete solids breakdown, or even system failure. In this post, we’ll dive into practical ways to evaluate digester performance and maintain optimal biological activity, with a spotlight on methane production, CO2 levels, solids breakdown rates, and indicators of a thriving mixed biomass.
Whether you’re managing a farm-scale digester or a large wastewater treatment plant, regular monitoring is key to maximizing efficiency and output. Let’s break it down step by step.
Measuring Methane Production: The Heart of Energy Yield
Methane (CH4) is the star of the show in anaerobic digestion, typically making up 50-70% of the biogas produced. High methane content means more energy potential for electricity, heat, or vehicle fuel. To evaluate performance here:
- Biogas Yield and Composition Analysis
Track daily biogas production volume using flow meters and analyze its composition with gas chromatographs or infrared sensors. Ideal methane levels hover around 60-65%; anything below 50% signals issues like incomplete methanogenesis. Tools like portable biogas analyzers can provide real-time data on CH4 percentages. - Specific Methane Yield
Calculate methane produced per unit of volatile solids (VS) fed into the digester (e.g., m³ CH4/kg VS). Benchmarks vary by feedstock—expect 0.2-0.4 m³/kg VS for manure—but consistent tracking reveals trends. A drop might indicate inhibition from toxins or pH imbalances.
To ensure optimal activity, maintain temperatures between 35-40°C for mesophilic digesters (or 50-60°C for thermophilic ones) and avoid overloading with high-fat substrates that can skew acid production. Regular mixing promotes even distribution of microbes and substrates, boosting methane output.
Monitoring CO2 Levels: Balancing the Biogas Equation
Carbon dioxide (CO2) is the other major biogas component, usually 30-50%, but excessive levels (over 40%) can dilute energy value and hint at inefficiencies. CO2 is produced during acidogenesis and acetogenesis stages, where bacteria convert organics into volatile fatty acids (VFAs) and other intermediates.
- Gas Composition Tracking
Use the same analyzers as for methane to monitor CO2 A rising CO2:CH4 ratio often points to acid accumulation, stressing methanogenic archaea. - Off-Gas Analysis
In advanced setups, measure dissolved CO2 in the digestate slurry, as high levels can lower pH and inhibit microbes.
For optimization, buffer the system with alkalinity (aim for 2,000-5,000 mg/L as CaCO3) to neutralize acids and keep CO2 in check. If CO2 spikes, reduce organic loading rates (OLR) to give archaea time to convert intermediates into methane.
Assessing Solids Breakdown Rates: Gauging Digestion Efficiency
Solids breakdown, often measured as volatile solids (VS) reduction or chemical oxygen demand (COD) removal, indicates how effectively the biomass is degrading feedstock. Target VS destruction rates are 40-60% for most systems, turning waste into stable digestate for fertilizer use.
- VS and Total Solids (TS) Testing
Sample influent and effluent weekly, then calculate reduction: (VS_in – VS_out) / VS_in × 100%. Labs use standard methods like EPA 1684 for accuracy. Slow breakdown? It could mean insufficient hydraulic retention time (HRT), typically 15-30 days. - COD and BOD Monitoring
Track chemical (COD) and biochemical oxygen demand (BOD) to quantify organic matter removal. High effluent COD (>1,000 mg/L) suggests incomplete digestion.
To enhance rates, ensure a balanced carbon-to-nitrogen (C:N) ratio (20-30:1) in feedstocks—too much nitrogen can produce ammonia, inhibiting breakdown. Co-digestion with diverse wastes (e.g., adding food waste to manure) can stimulate microbial diversity and accelerate degradation.
Signs of a Healthy Mixed Biomass: Bacteria and Archaea in Balance
The magic happens thanks to a diverse consortium: hydrolytic and fermentative bacteria break down polymers into sugars and acids, acetogenic bacteria convert those to acetate, and methanogenic archaea (like Methanosarcina and Methanosaeta) produce methane. A healthy biomass is resilient, with balanced populations preventing souring or foaming.
- pH and Alkalinity Checks
Daily pH monitoring (optimal 6.8-7.4) is crucial—drops below 6.5 indicate VFA buildup from overactive bacteria, stressing archaea. Alkalinity buffers this; ratios of intermediate to total alkalinity (IA:TA < 0.3) signal health. - Volatile Fatty Acids (VFA) Analysis
Measure VFAs like acetate and propionate via chromatography. Levels under 1,000 mg/L are ideal; spikes suggest bacterial dominance over archaea. The acetate:propionate ratio should be >1 for smooth methanogenesis. - Microbial Community Profiling
Advanced tools like 16S rRNA sequencing or qPCR quantify bacteria vs. archaea ratios (aim for 10-20% archaea). Visual signs include a granular sludge in upflow anaerobic sludge blanket (UASB) reactors or no foul odors (H2S indicates sulfate-reducing bacteria overwhelming methanogens). - Microscopy and Activity Tests
Simple microscope checks for cell morphology and motility; methanogenic activity tests (e.g., specific methanogenic activity, SMA) measure how quickly archaea consume substrates.
To foster this balance, inoculate with healthy sludge during startup, control inhibitors like heavy metals or antibiotics, and maintain stable conditions. If imbalances occur, bioaugmentation—adding specific microbial cultures—can restore vitality.
Putting It All Together: Best Practices for Long-Term Success
Evaluating and optimizing anaerobic digesters isn’t a set-it-and-forget-it affair. Implement a monitoring regime: daily for pH and gas production, weekly for VS and VFAs, and monthly for microbial analysis. Use data logging software to spot trends early. If performance dips, troubleshoot systematically—adjust loading, temperature, or mixing before it cascades into failure.
By focusing on these metrics, you not only boost methane yields and solids reduction but also cultivate a robust microbial ecosystem. This leads to more reliable operations, lower maintenance costs, and greater environmental benefits.
